Volume 2, Issue 2
Parameters that Define Resolution in Microscopy
By Ridthi Patel

is a fourth-year Biology student concentrating in Cell and Molecular Biology and in the early-entry masters program. Her research area focuses on the Neuroscience and stem cell research to understand neural development and degeneration. Her research advisor is Dr. Alain Burette from the Department of Cell Biology and Physiology at the University of North Carolina at Chapel Hill Neuroscience Center.
Abstract
Microscopy, especially confocal microscopy, is an extremely powerful imaging tool for visualizing subcellular structure, but quantitative measurements in confocal images are prone to distortion depending on how the instrument is configured. This study investigates how two key acquisition parameters, the confocal pinhole size and the fluorophore emission wavelength, can affect the apparent feature diameter and, consequently, the effective resolution of images. Using P60 wild-type mouse brain tissue, stained for neurofilaments with SMI-31 primary antibodies, and multiple secondary antibodies (Alexa Fluor 488, 594, 647), as well as fluorescent beads, images were acquired on a Leica Stellaris 5 confocal microscope across a range of pinhole sizes and emission channels. The feature diameters were quantified from intensity profiles using ImageJ and summarized into graphs. Our findings aligned with the idea that as the pinhole size increased, the bead filament diameters also systematically increased. This is consistent with greater transmission of out-of-focus light and image blurring. Conversely, as the pinhole decreased, sharper but dimmer images were produced. Thus, illustrating the tradeoff between resolution and signal. Similarly, longer emission wavelengths were associated with larger measured filament diameters. Reflecting the fundamental link between wavelength and diffraction-limited resolution. Altogether, these findings demonstrate that both pinhole size and fluorophore wavelength significantly influence the measured structure size in confocal images, underscoring the need to optimize and standardize these parameters when performing quantitative morphometric analyses.
Resolution, Confocal Microscopy, Myelin, Pinhole size, Frequency, Background
Introduction
Microscopy is an important tool widely used to discover the makeup of cells and tissues. It allows for the visualization of minuscule biological structures, otherwise invisible to the naked human eye. Through this process, new discoveries are made by examining the fine details of the images leading to different therapies and solutions to various disorders and conditions. Among all types, confocal microscopy is the workhorse of microscopes [1]. The main purposes of a confocal microscope are optical sectioning for 3D representations of imaged samples and producing a point source of light and rejecting out-of-focus light, enabling deep tissue viewing with high resolution [5]. Confocal microscopy uses a pinhole to reject out-of-focus light, thereby sharpening the image [1]. To operate a confocal microscope correctly, it is essential for the user to understand its inner workings, especially for quantitative analysis. For the best possible images, Two important factors affecting resolution are the pinhole size and emission wavelength [1]. Here we are studying how changing the pinhole size and emission wavelength affect image qualities.
To understand how to attain the best results when imaging, it is crucial to understand the physics behind the working confocal microscope and how an image is produced through its mechanics. We imaged with a microscope that had two laser options. There is a white light laser with up to five visible line lasers ranging from 485 nm to 685 nm and an ultraviolet laser with a wavelength of 405 nm [6]. From there, whichever laser is chosen is then filtered through what is known as an acousto-optical tunable filter (AOTF) [6]. The white light laser is split into two beams going in opposite directions, and the UV laser beam only goes in one [6]. Then, if the white light laser is chosen, the beam path that goes in the same direction as the UV laser then goes through the acousto- optical beam splitter [6]. The purpose of the beam splitter is to separate the path of light that is being omitted from the white light laser and connect it to a visual medium such as a camera that is attached to the microscope [1,5,6]. Similarly, if the UV laser is selected, it has to pass through the UV laser incoupling, which also allows for the transfer of this beam of light into an electronic viewing camera device [1,6,9]. After that, the paths followed by the UV and white light lasers follow the same path. Next, they go through a tandem scanner. This consists of a three-mirror scanning base with an interchangeable motorized mechanism for the x-scanner [6]. With this setup, it is possible to use a FOV scanner to scan huge regions with a high scan resolution and a resonant scanner to scan very quickly, both within the same instrument [1,6,9]. Next, the beam passes through an HIVISR optics lens and into the scan field rotation system. It allows you to virtually rotate the field of view [1,6,9]. Next, it goes through the selected objective lens. Normally, these range from 4x, 10x, 40x, and 63x and 100x oil immersion lenses [6,8]. Due to the light being diffracted multiple times when using the high-magnification objective lenses, the oil is used due to its refractive index, which permits the objective to gather more light to create an image and prevent any air gaps and refraction-related light loss [8,18]. Lastly, this end of the beam reaches the eyepiece, where the tissue can be seen with the naked eye [6]. This is only possible, though, because of the way the other beam of the split white light laser goes. As previously mentioned, the white light laser is split into two and the other beam goes in the opposite direction. First, it goes through the square confocal pinhole and then the fluorophore disc [6]. After that, color is detected from the secondary antibodies in the tissue by the SP detection system after the beam passes through the prism-based dispersion reflector [1,6,9,16].
Confocal microscopes, like all microscopes, are subject to the limitations imposed by light diffraction. This can be seen through a value known as the numerical aperture [10,17]. The numerical aperture of a microscope objective is an indicator of how well it can collect light and distinguish minuet details in a specimen when operating at a set distance [10,15,17]. Resolution is inextricably tied to both the wavelength of light employed and the numerical aperture (NA) of the optical elements of a microscope, such as the objective lens [8,9,15,10]. Resolution in microscopy refers to a microscope’s capacity to identify specific details in a specimen or sample. The smallest distance at which an observer or a microscope camera can still distinguish between two distinct points on a specimen [1,5]. In addition to the objective lens, in a confocal microscope, light also goes through a pinhole, a small hole that allows you to reject any out of focus light [1]. Light of a specific wavelength is shot through the pinhole to then illuminate the tissue and form a visual image that is captured by the camera [1,19]. Smaller slit width results in better resolution but lower illumination— while large slit width results in better illumination but lower resolution [1,5,12]. The light wavelengths also play an important role. Frequency of light and resolution are directly correlated, with high frequency resulting in higher resolution and low frequency resulting in lower resolution [1,5,15]. Since frequency and wavelength are inversely related, this would mean that light with a larger wavelength would have lower resolution and light with a smaller wavelength would have higher resolution [1,5,15]. And lastly, the diameter of structures viewed would be inversely proportional to the resolution and amount of light gathered [1,5,13]. The practical implication is that when one is looking at very fine structures, such as neurofilaments, one needs to be careful with quantitative measurements, as the apparent object sizes will change with microscope parameters. Here we investigate how the size of the pinhole and the choice of fluorophores influence microscope quantification.
Materials and Methods
Animal Tissue Preparation
We used an adult P60 wild type mouse.
We deeply anesthetized P60 mice with sodium pentobarbital (60mg/kg, i.p.) before transcardially perfusing them with heparinized saline (0.9% NaCl, 10 IU heparin/ml), immediately followed by phosphate-buffered 4% paraformaldehyde, pH 7.3, at a rate of 9ml/min. After delivering 50 ml of fixative, we decapitated mice, postfixed their heads overnight at 4°C, and rinsed and stored them in PBS at 4°C until ready to be used [10].
Immunohistochemistry
We rinsed sections several times in phosphate buffered saline (PBS), then 50% methanol and PBS, and finally PBS for 1 hour at room temperature. Sections were incubated at 37°C for 2hrs in permeabilization solution (0.2% TritonX-100, 2% glycine, 20% dimethylsulfoxide in PBS) followed by 1h in blocking solution (0.2% TritonX-100, 1% fetal bovine serum). Sections were then incubated overnight with IgG mouse anti-SMI-31 antibody (1:500) in antibody solution (0.2% Tween-20, 40mg/l heparin, 11% bovine serum albumin, 5% dimethylsulfoxide in PBS ). Next, the sections were washed in Tween X-100 (PBS-T) 3 times for 5 mins at room temperature and incubated in a mixture of Alexa Fluor Donkey Anti mouse (Alexa Fluor 488, 594 and 647 at 1:400;) in antibody solution overnight. Finally, we rinsed sections several times in PBS-T and then PBS before mounting the sections on gelatin covered slides and coverslipping with vectashield. The prepared slides were then stored at 4° C [10].
Image Acquisition and Processing
Slides were imaged on the Leica Stellaris 5 Confocal Microscope.
Tissue
The tissue was imaged on xyz scan mode, at 400 Hz scan speed, HC PL APO CS2 100x/1.40 OIL objective with 1.518 refraction index, and channel detectors SiPM (432nm-476nm), HyD (504nm 583nm), and SiPM (663nm-750nm).
Beads
The beads were imaged in xyz scan mode at 400 Hz scan speed with an HC-PL APO CS2 100x/1.40 OIL objective and channel detector SiPM (496nm 739nm).
Data Processing
The data for graphs of diameter measured compared to wavelength and pinhole size was collected through the histogram feature of ImageJ software. Graphs were made in Microsoft Excel.
Figure Production
We adjusted the pseudocolor images using a “fire” lookup table and measured the diameters of structures represented in images in microns. We also measured and recorded the diameters of microfilament structures multiple times for each image to view the average overall change. All images meant for direct comparison within figures underwent identical manipulations. All image editing was done with ImageJ software, and all figures were prepared using Corel Draw software.
Results
The present study found that increasing pinhole size results in an increase in diameter. A smaller pinhole allows sharper imaging with more defined structures (Figure 1). A larger pinhole allows more light to pass through, resulting in greater illumination and elongation of structures (Figure 2).
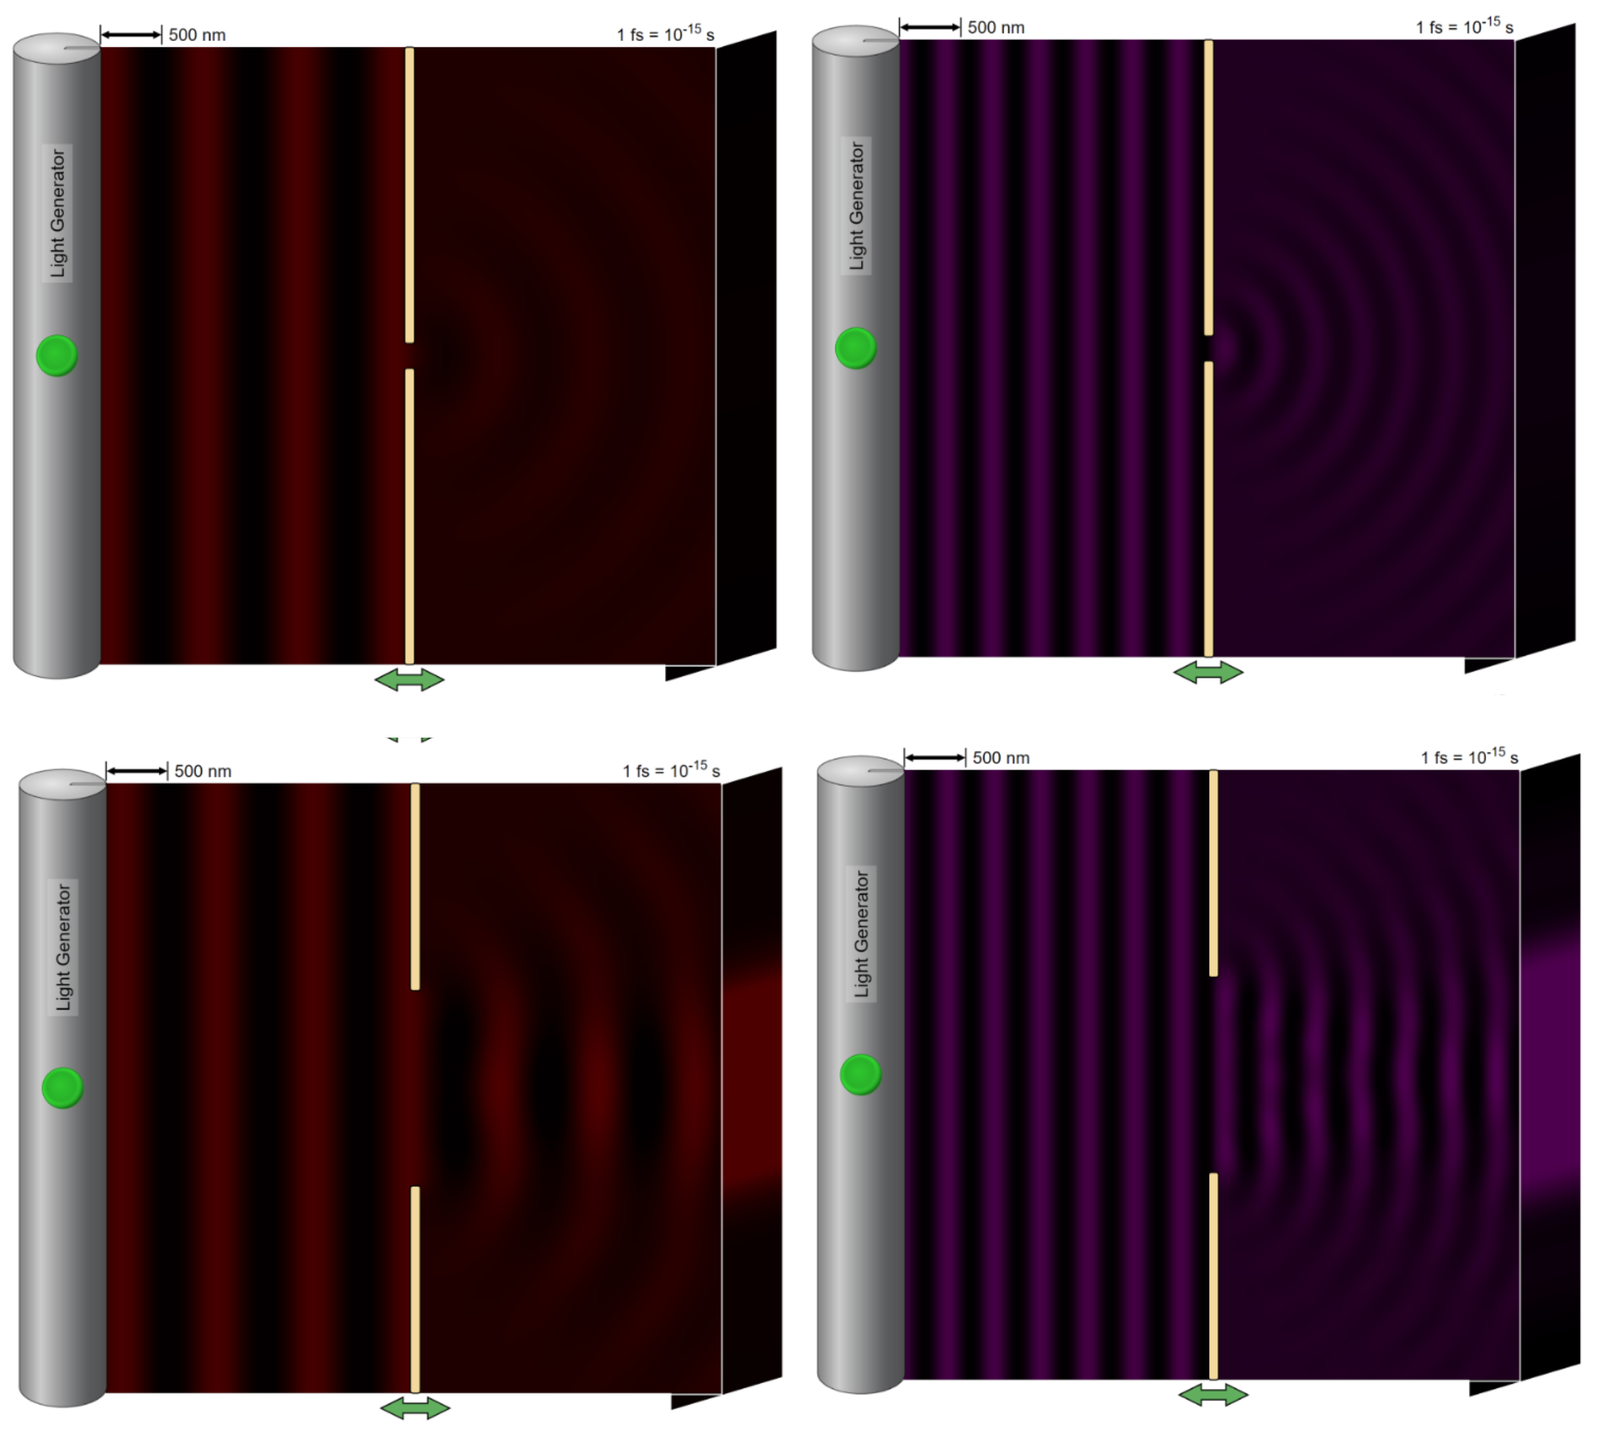
Figure 1 – Laser light of the highest frequency (red) and lowest frequency (violet) is shot through the smallest pinhole size.(Figure created with Phet Interactive Stimulations software.)
Figure 2 – Laser light of the highest frequency (red) and lowest frequency (violet) is shot through the largest pinhole size. (Figure created with Phet Interactive Stimulations software.)
The purpose of the pinhole is to eliminate any out-of-focus light. Imaging with a large pinhole would provide better light gathering of the section but would result in a loss of resolution due to unnecessary light passing through, suggesting a blurred image with an increase in diameter will be observed. To determine whether pinhole size and small feature diameter are directly related, we recorded diameter length across images collected of the same bead with ten different pinhole sizes (0.3, 0.6, 0.9, 1.2, 1.5, 1.8, 2.2, 2.6, 2.9, and 3.3 airy units [AU] ). We measured the diameter from one asymptotic tail to the other on the histogram. We subsequently verified that as pinhole size increased, the diameter of the bead also increased, via blurring of the image from excess light (Figure 3).
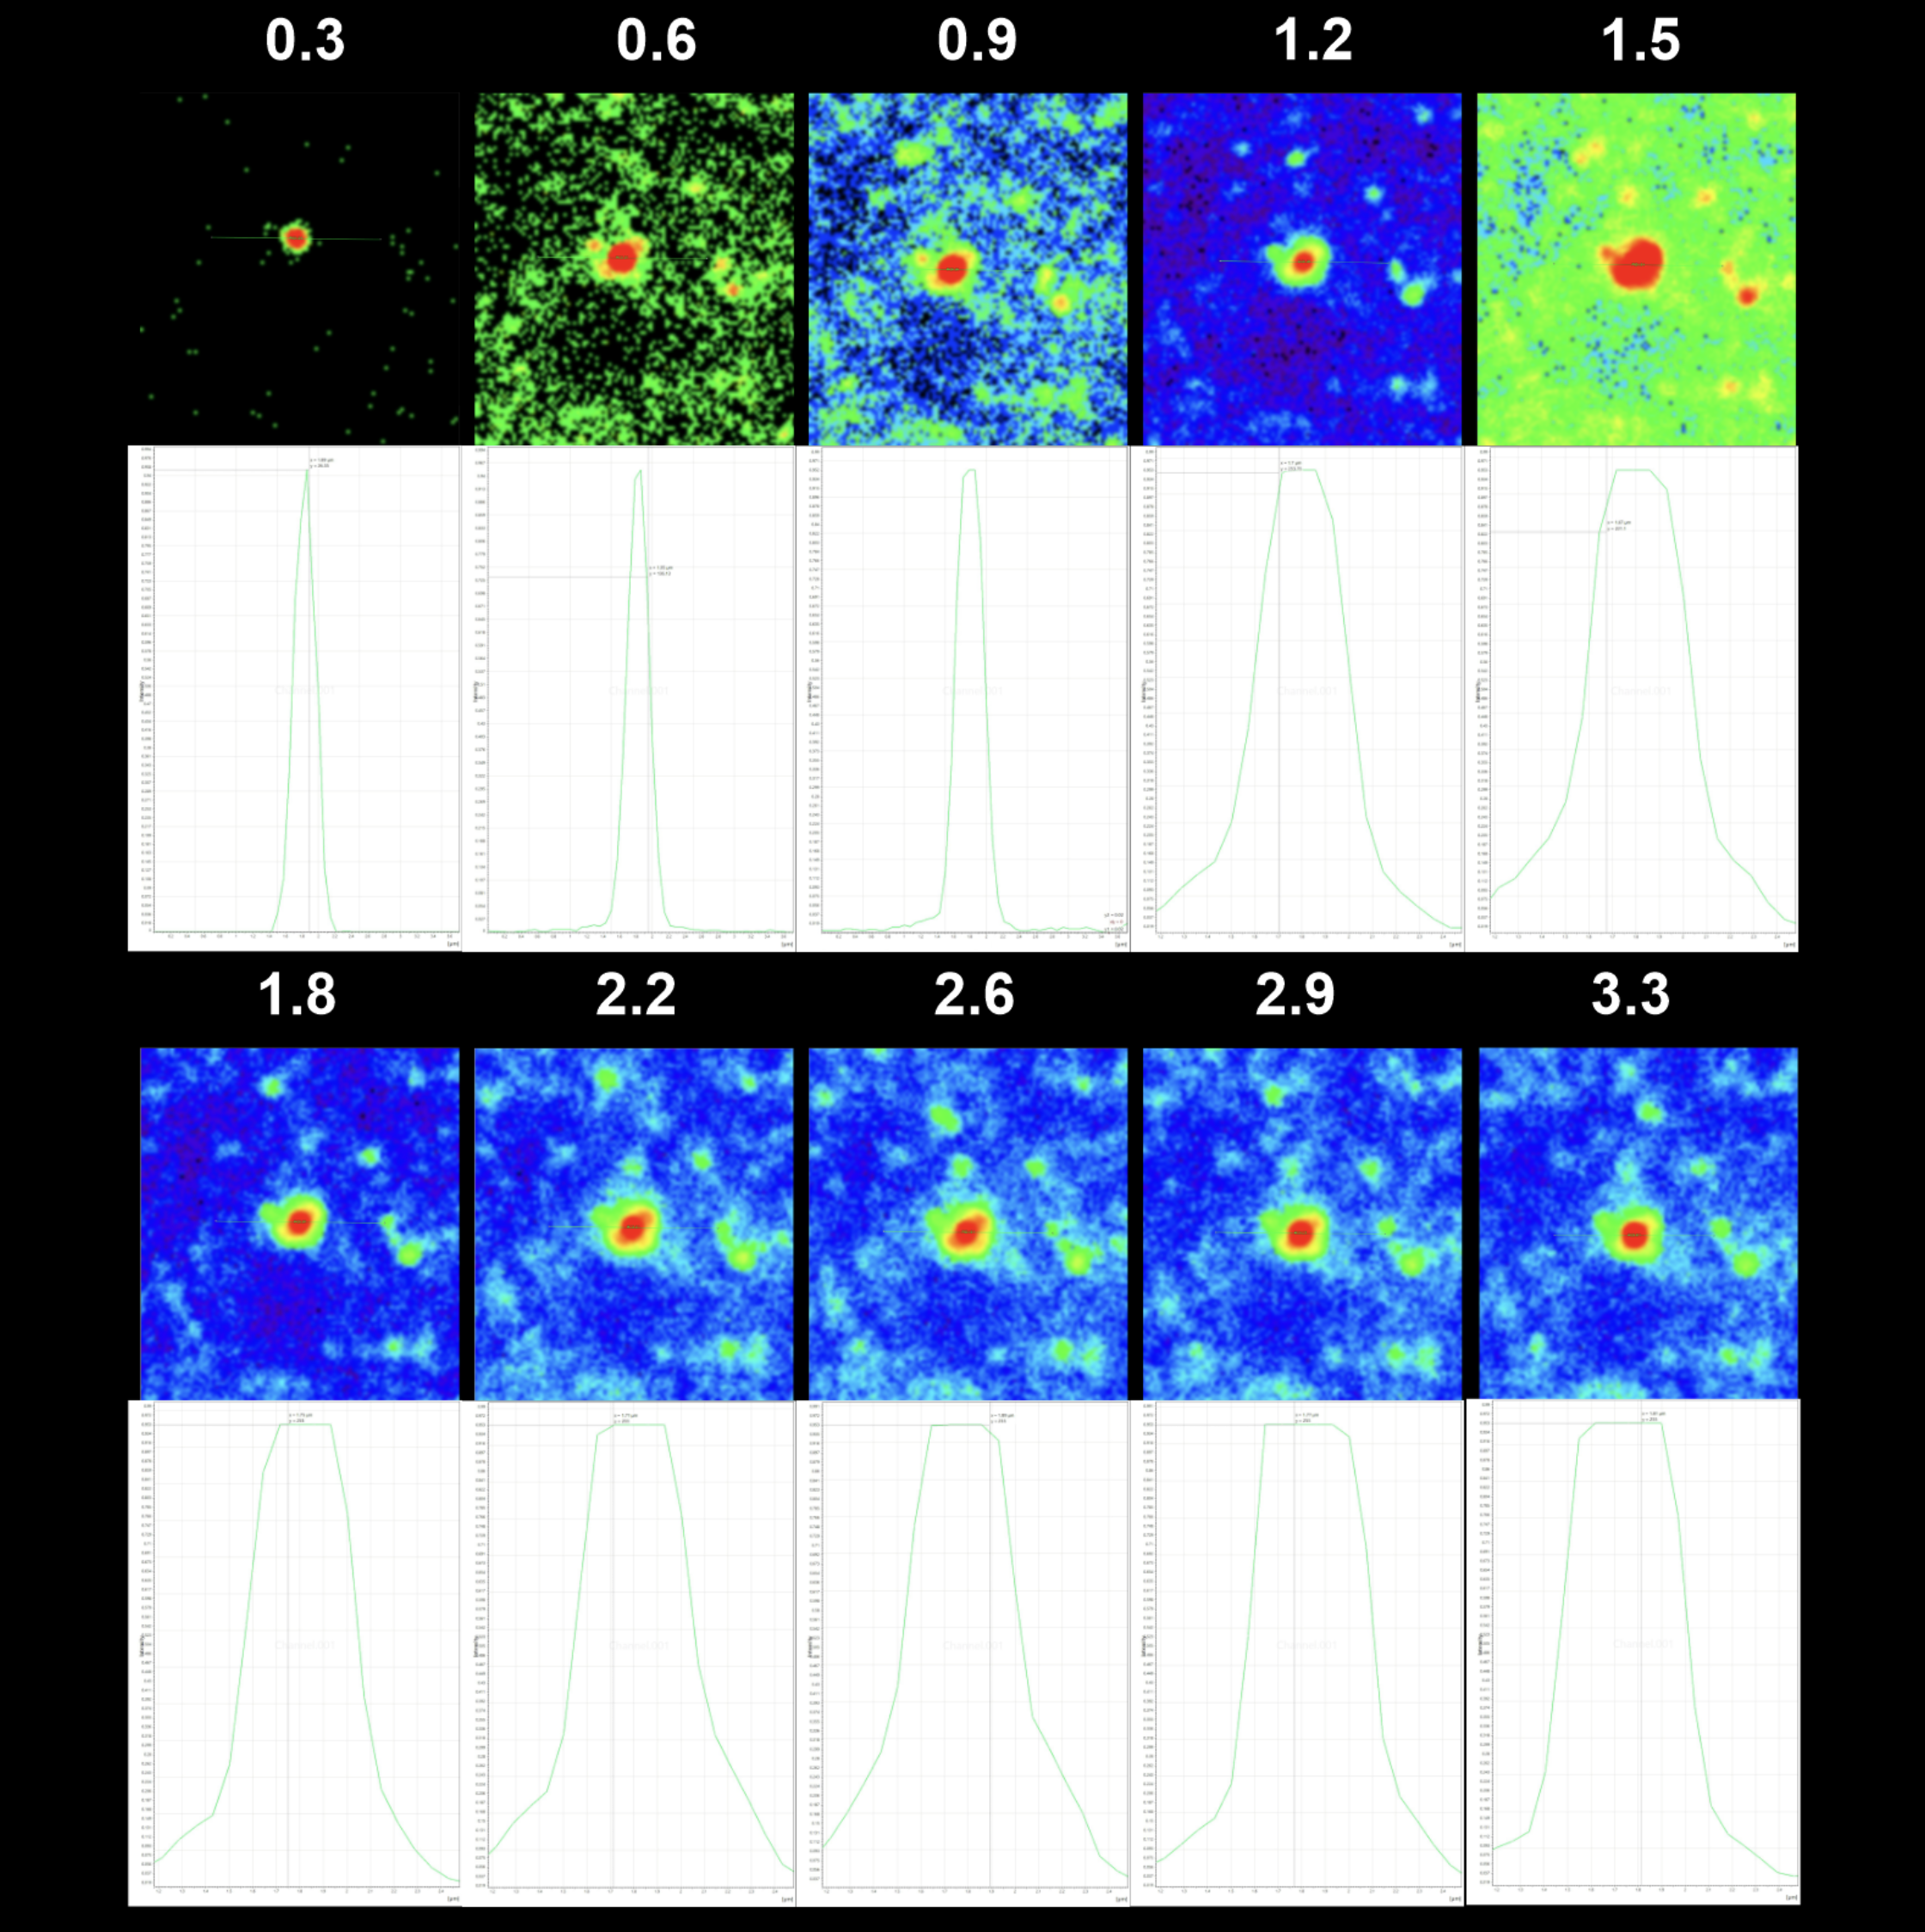
Figure 3 – A594 stained bead images and histograms of diameter at largest Z-stack slice. The top measurement values indicate the pinhole size and the horizontal displacement under histogram curve indicates the diameter.
We imaged P60 WT mouse stained for IgG mouse anti-SMI-31 (neurofilament detector) and then imaged sections at five different pinhole sizes (0.63, 1, 1.6, 2.6, and 4). The graph shows an increasing trend between pinhole size and filament diameter (Figure 4).
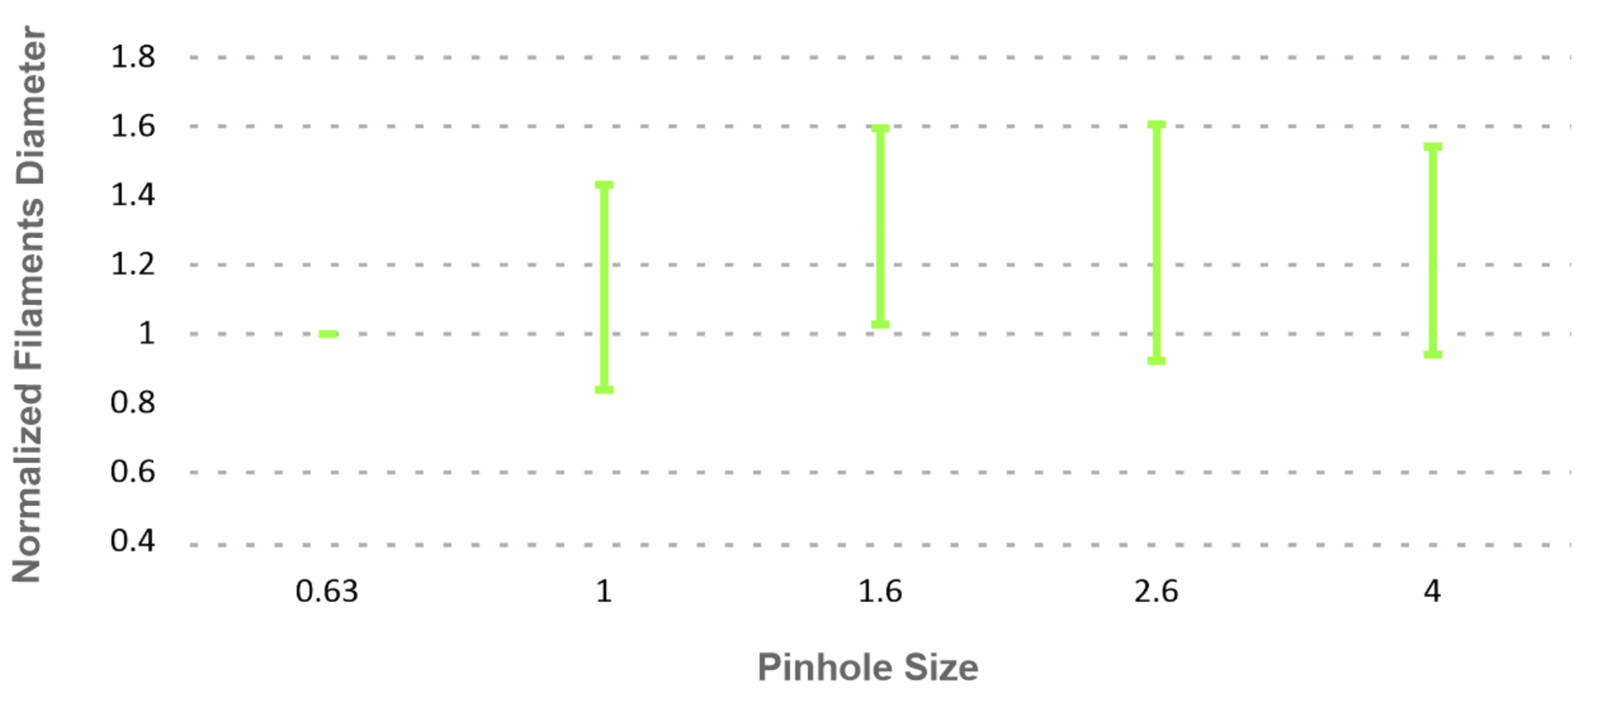
Figure 4 – A graph of pinhole size and normalized filament diameter analysis.
Increasing wavelength results in an increase in diameter. The findings show that when different light wavelengths are fired through a slit of the same width, structure diameters and wavelengths increase in a directly proportional manner (Figure 5).
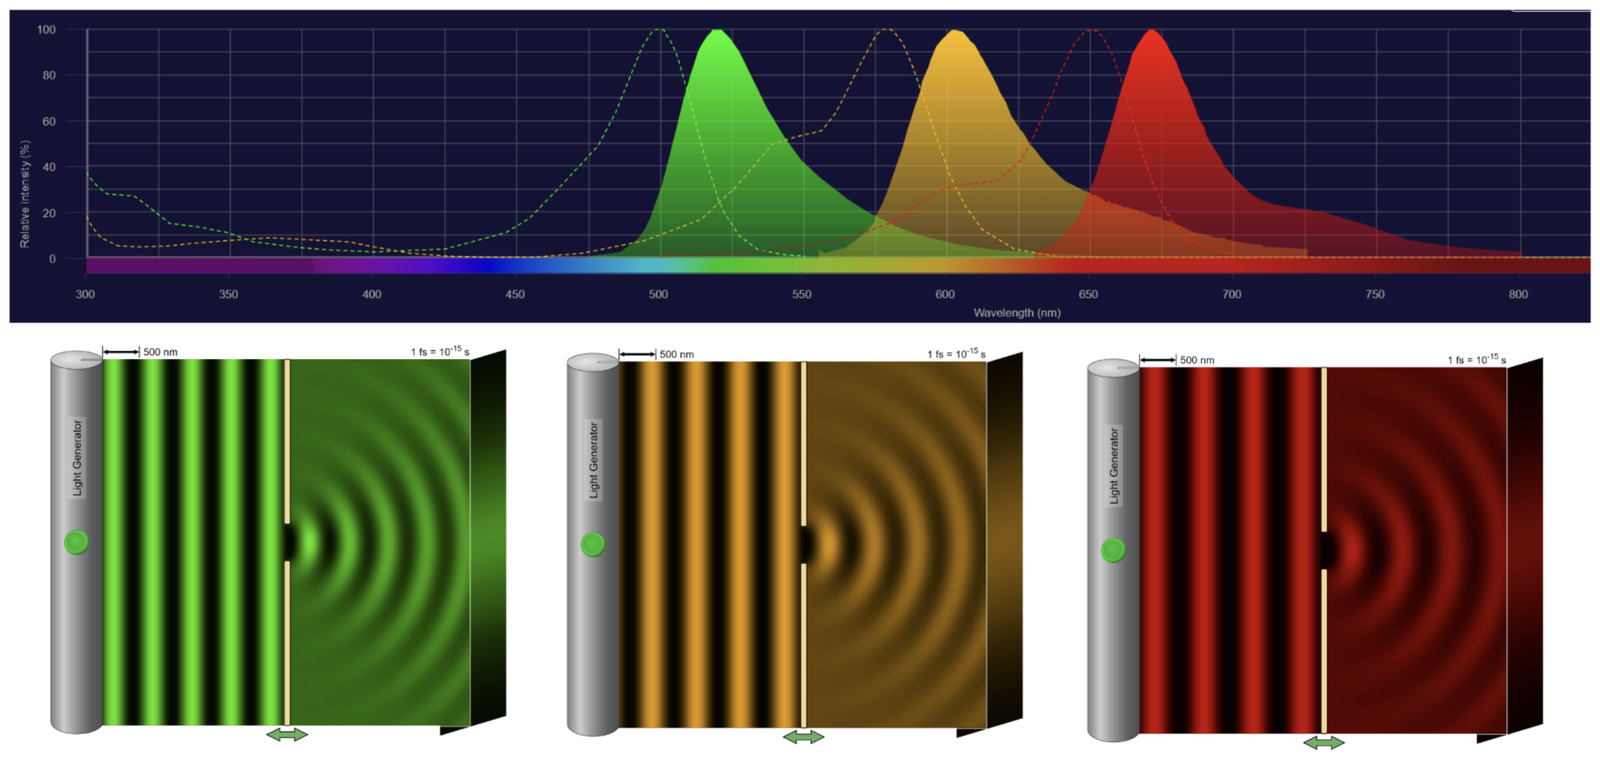
Figure 5 – Top – wavelength spectra of A488, A594, and A647 staining are shown, representing the wavelength at which light is shot (dotted peaks) and the wavelength at which it fluoresces (solid peaks). bottom – laser light of wavelengths A488, A594, and A647 is shot through a slit of the same width. (Figure created with Thermofisher Fluorescence Spectra Viewer software and Phet Interactive Stimulations software.)
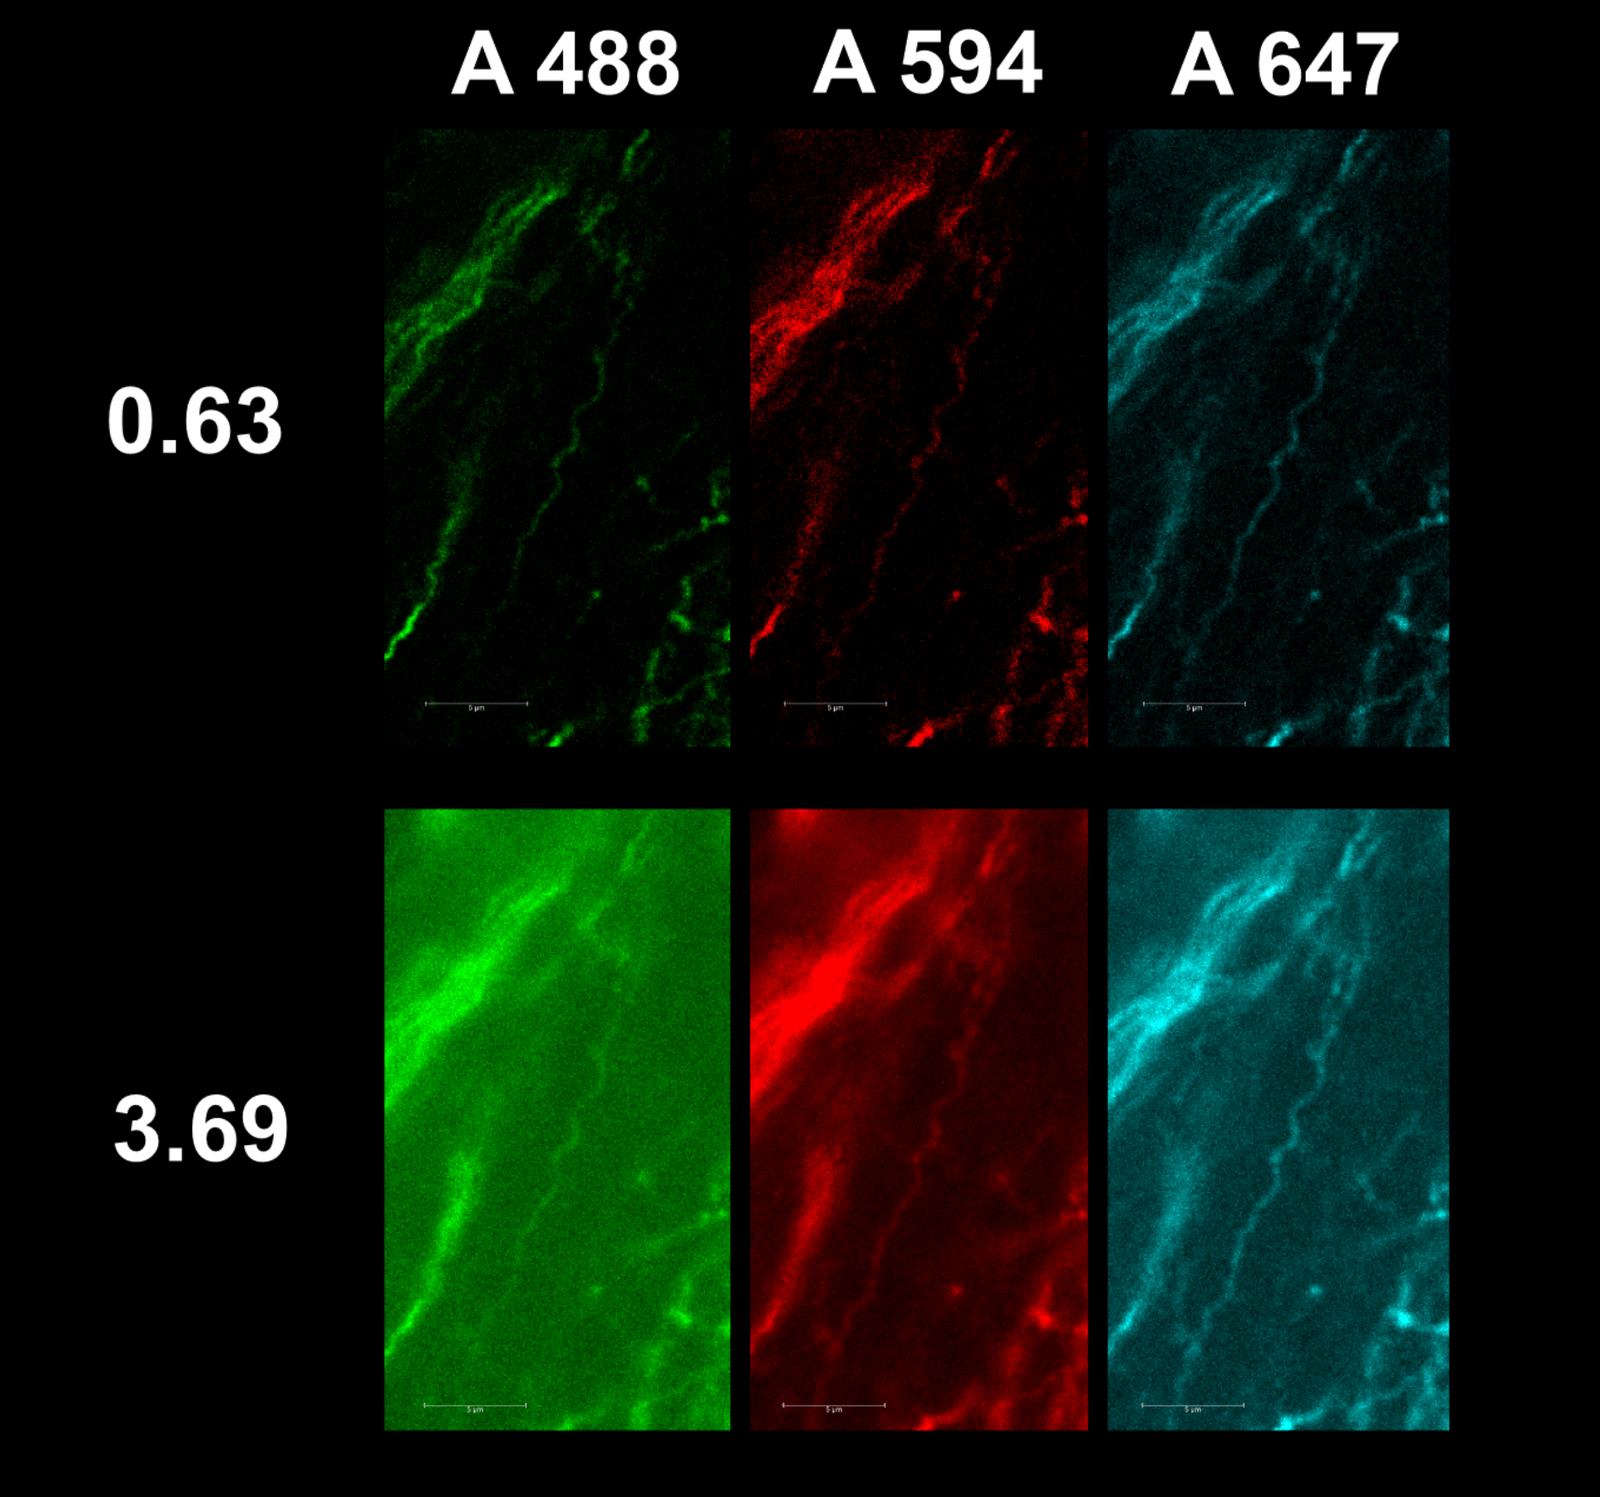
Figure 6 – We imaged P60 WT mouse stained for IgG mouse anti-SMI-31 and secondary antibodies of DK IgG anti-mouse with Alexa Fluor 488, Alexa Fluor 594, Alexa Fluor 647 and then imaged sections at pinhole sizes of 0.63 and 3.69.
Results confirm that greater wavelength and pinhole decrease resolution and increase the diameters of filaments in images. It can also be seen that access light from a large pinhole creates excessive background noise on images making differentiation between filaments difficult. While a smaller pinhole provides better resolution, a lack of illumination causes images to appear dull and hard to view (Figure 6). We imaged P60 WT mice stained for IgG mouse anti-SMI-31 and secondary antibodies of DK IgG anti-mouse with Alexa Fluor 488, Alexa Fluor 594, and Alexa Fluor 647, and then imaged sections at pinhole sizes of 0.63 and 1.9, and discovered that as pinhole and wavelength increased, so did diameter (Figure 7).
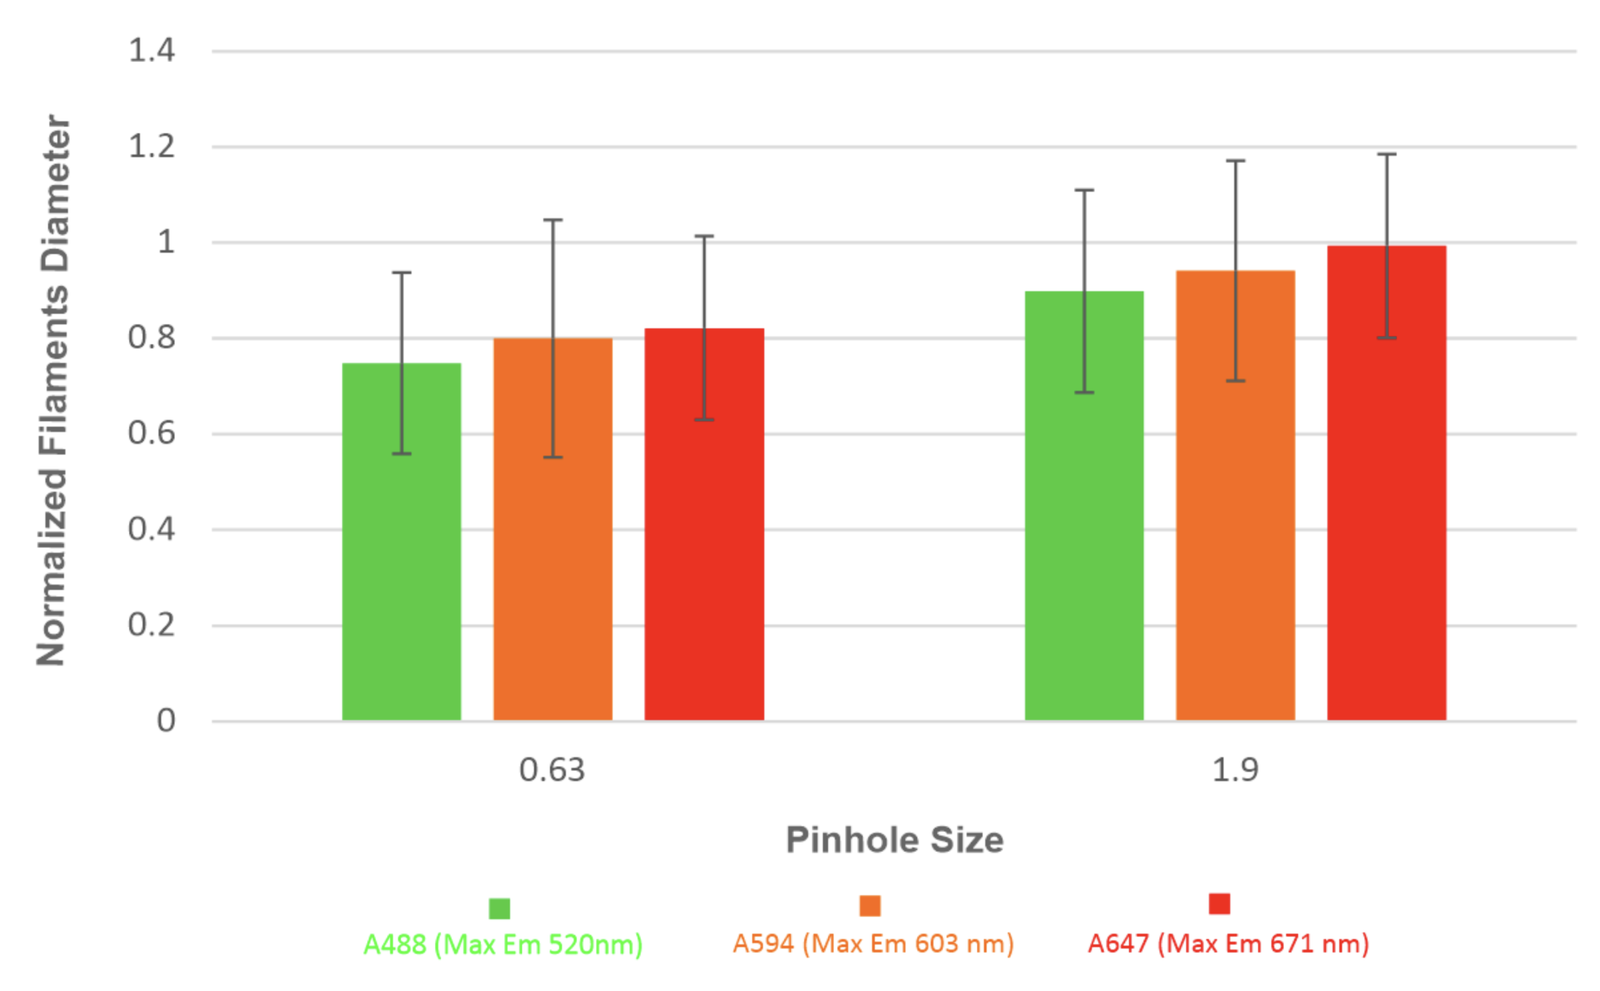
Figure 7 – A bar graph with standard error lines of pinhole size and normalized filament diameter of three different wavelengths (A488, A594, and A647)
Discussion
Pinhole and Diameter Relation
The present findings show a correlation between pinhole size and object diameter. My observations of increased diameter resulting from an enlarged pinhole are substantiated by figures 1, 2, 3, 4, 6, and 7. Since the pinhole’s purpose is to block out-of-focus light, when it is larger, the extraneous light isn’t being blocked as effectively, making the minuscule fine details of specimen tissue appear larger and out of focus [1,11]. Conversely, a pinhole that is very small will make filaments defined but lack of illumination of tissue provides for an image that is dark and lacks brightness [1,11]. It is important to note that there are downsides to having a pinhole that is either too large or too small. When imaging it is important to remember that although the pinhole is a unique feature that can assist in creating crisp images with defined details at a high resolution, overusing it can lead you to get the opposite result [12,13]. To achieve the best results, the size of the pinhole should be balanced so that there is enough illumination to clearly see the specimen but not so much that minuscule fine details are indistinguishable [12,13].
Wavelength and Diameter Relation
Our results also show a correlation between wavelength and object diameter. Our observations of increased diameter due to a larger wavelength are supported by figures 1, 2, 5, 6, and 7. The lateral resolution of the microscope is limited by diffraction and is commonly approximated by the Abbe/Rayleigh relation d=λ/(2NA) [20]. This convention outlines that the smallest resolvable distance between two points gets smaller when the wavelength decreases or the numerical aperture increases [20]. In the practical applications that this paper aims to provide, this tells you that higher NA-optics and shorter wavelengths improve lateral resolution, but they cannot eliminate the fundamental blur that is caused by diffraction [20]. Thus, resolution is improved with shorter illumination wavelengths and larger numerical aperture, but features separated by less than this limit are unlikely to be distinguished as separate objects under conventional imaging conditions [20]. Since frequency and wavelength are inversely related, light of a higher wavelength would be longer and scatter more when it hits an object [1,14]. Like a large pinhole, this would also cause filament details to become undefined and appear blurry and larger [14]. To combat this issue and achieve optimal imaging results, the parameters derived from pinhole size must be applied [13,14]. The viewing wavelength cannot be easily changed because staining sections is time-consuming. Limiting yourself to a range of low-wavelength secondary antibodies is also impractical when multiple staining immunofluorescence is required [16]. In this situation, a slightly smaller pinhole with a larger wavelength is preferable to maximize the cancellation of resolution lost to blurring [1,15].
Knowledge of correct microscopy techniques is essential for ideal imaging results and that starts with understanding the fundamental systems of the instrument. With better grasp of how the main components of the confocal microscope work, users can achieve optimal results to aid in research. The quality of life for those affected is significantly improved by analyzing and quantifying data obtained from high-quality microscopy, which is then used to develop therapies and treatments for diseases
Acknowledgements
References
- Elliott, A. D. (2019). Confocal microscopy: Principles and modern practices. Current Protocols in Cytometry, 92(1), e68. https://doi.org/10.1002/cpcy.68
- United States Patent and Trademark Office. (n.d.). Petition documents (Artifact ID: NZWHEUqDP87XqN8eKGttoyOE3YLcpp_agn9-P4cMJler964GEb__t4c). https://ptacts.uspto.gov/ptacts/public-informations/petitions/1541483/download-documents?artifactId=NZWHEUqDP87XqN8eKGttoyOE3YLcpp_agn9-P4cMJler964GEb__t4c
- Wilson, T. (2011). Resolution and optical sectioning in the confocal microscope. Journal of Microscopy, 244(2), 113–121. https://doi.org/10.1111/j.1365-2818.2011.03549.x
- McDonald-McGinn, D. M., Sullivan, K. E., Marino, B., Philip, N., Swillen, A., Vorstman, J. A. S., Zackai, E. H., Emanuel, B. S., Vermeesch, J. R., Morrow, B. E., Scambler, P. J., & Bassett, A. S. (2015). 22q11.2 deletion syndrome. Nature Reviews Disease Primers, 1, 15071. https://doi.org/10.1038/nrdp.2015.71
- Cox, G., & Sheppard, C. J. R. (2004). Practical limits of resolution in confocal and non-linear microscopy. Microscopy Research and Technique, 63(1), 18–22. https://doi.org/10.1002/jemt.20019
- Leica Microsystems. (2026). STELLARIS scan head poster. https://downloads.leica-microsystems.com/STELLARIS/Poster/STELLARIS%20Scan%20Head_poster.pdf
- Otterstrom, J. (2022). How oil immersion objectives can improve your microscopy? IDEA Bio-Medical. https://idea-bio.com/how-oil-immersion-objectives-can-improve-your-microscopy/
- Wilson, M., DeRose, J., & Greb, C. (2018). Microscope resolution: Concepts, factors and calculation. Leica Microsystems. https://www.leica-microsystems.com/science-lab/life-science/microscope-resolution-concepts-factors-and-calculation/
- Abramowitz, M., & Davidson, M. W. (n.d.). Numerical aperture and resolution. Olympus Life Science. https://www.olympus-lifescience.com/en/microscope-resource/primer/anatomy/numaperture/
- Judson, M. C., Burette, A. C., Thaxton, C. L., Pribisko, A. L., Shen, M. D., Rumple, A. M., Del Cid, W. A., Paniagua, B., Styner, M., Weinberg, R. J., & Philpot, B. D. (2017). Decreased axon caliber underlies loss of fiber tract integrity, disproportional reductions in white matter volume, and microcephaly in Angelman syndrome model mice. Journal of Neuroscience, 37(31), 7347–7361. https://doi.org/10.1523/JNEUROSCI.0037-17.2017
- Glazowski, C., & Rajadhyaksha, M. (2012). Optimal detection pinhole for lowering speckle noise while maintaining adequate optical sectioning in confocal reflectance microscopes. Journal of Biomedical Optics, 17(8), 085001. https://doi.org/10.1117/1.JBO.17.8.085001
- Shihan, M. H., Novo, S. G., Le Marchand, S. J., Wang, Y., & Duncan, M. K. (2021). A simple method for quantitating confocal fluorescent images. Biochemical and Biophysical Reports, 25, 100916. https://doi.org/10.1016/j.bbrep.2021.100916
- Waters, J. C. (2009). Accuracy and precision in quantitative fluorescence microscopy. Journal of Cell Biology, 185(7), 1135–1148. https://doi.org/10.1083/jcb.200903097
- Li, Y., & Huang, F. (2024). A statistical resolution measure of fluorescence microscopy with finite photons. Nature Communications, 15(1), 3760. https://doi.org/10.1038/s41467-024-48155-x
- Strasser, F., Offterdinger, M., Piestun, R., & Jesacher, A. (2019). Spectral image scanning microscopy. Biomedical optics express, 10(5), 2513–2527. https://doi.org/10.1364/BOE.10.002513
- Piston D. W. (1998). Choosing objective lenses: the importance of numerical aperture and magnification in digital optical microscopy. The Biological bulletin, 195(1), 1–4. https://doi.org/10.2307/1542768
- Sheppard, C. J., & Gu, M. (1991). Aberration compensation in confocal microscopy. Applied optics, 30(25), 3563–3568. https://doi.org/10.1364/AO.30.003563
- Diaspro, A., Annunziata, S., & Robello, M. (2000). Single-pinhole confocal imaging of sub-resolution sparse objects using experimental point spread function and image restoration. Microscopy research and technique, 51(5), 464–468. https://doi.org/10.1002/1097-0029(20001201)51:5<464::AID-JEMT9>3.0.CO;2-D
- Euan McLeod, Aydogan Ozcan, Nano-imaging enabled via self-assembly, Nano Today, Volume 9, Issue 5, 2014, Pages 560-573, ISSN 1748-0132, https://doi.org/10.1016/j.nantod.2014.08.005. (https://www.sciencedirect.com/science/article/pii/S174801321400125X)